
Subscription reports
Research
Athena's reading, with its method in plain view: data, models and scenarios.
Four reports a month, one per asset class (interest rates, currencies, equities and commodities), global with a US focus.
- Proprietary models, with their reading each month
- Each view, with what would change it
- USD 19 for one or USD 39 for all four, a month + VAT
Sample · Equities No. 0
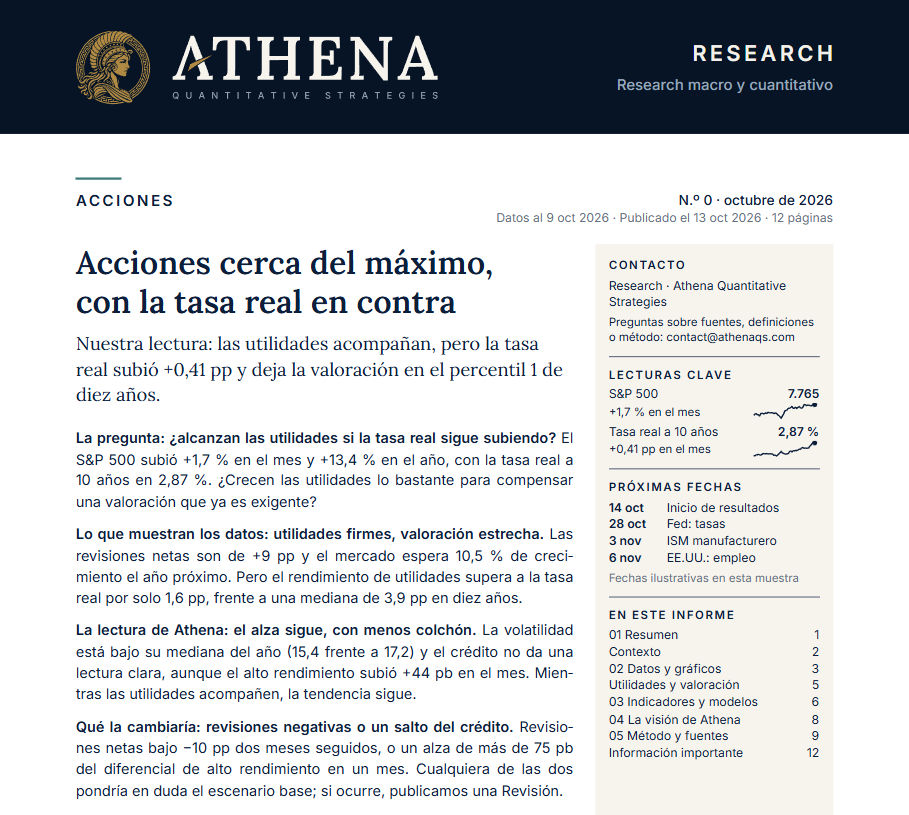
Five parts, always in the same order: from data to view.
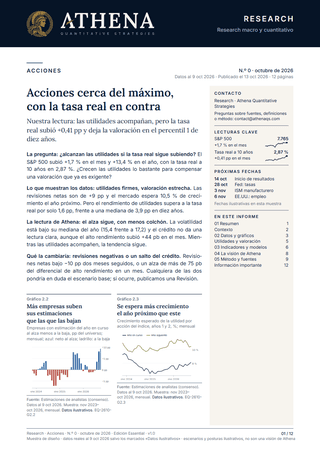
Summary
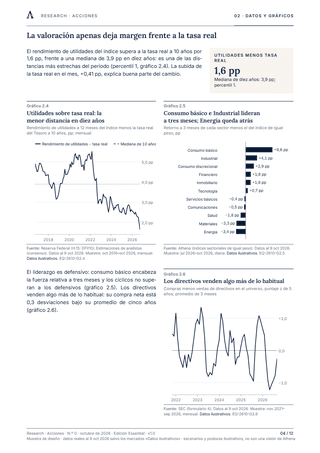
Data and exhibits
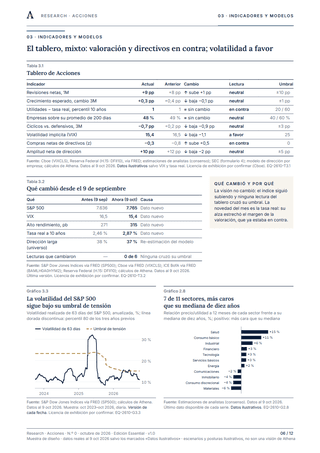
Indicators and models
Athena’s view
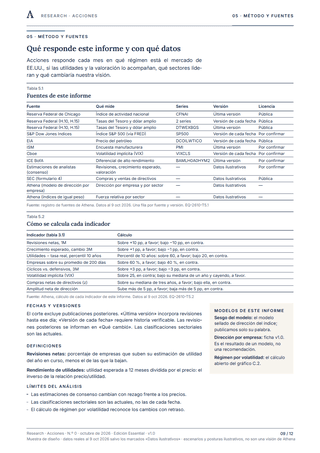
Method and sources
A complete view for decision-making: quantitative models, context and judgment.
Models are a tool, not the answer. We start from those of our quantitative research platform, knowing what each one provides and what it can’t, and do the complete interpretation: we test them against the economic context, monetary policy and what prices are doing, until we reach a stance per asset class, with its reasoning and what would change it.
Economic cycle
Cycle stage · data cycle · probability of each phase
- What it looks at
- Which phase the economy is in: growing above or below its trend, and speeding up or slowing down.
- How it works
- It reads the cycle two ways: the OECD leading indicator against its trend, alongside unemployment; and a Chicago Fed index that sums up 85 monthly series, by its level and its change over six months.
- What it provides
- The backdrop: which asset classes have tended to suffer or benefit in each phase, and which data point would confirm the move to the next.
- What it can’t tell
- It doesn’t date phase changes in time: the data arrive a month late and get revised.
Slowing ← 6-month change → Speeding up
From the models to the view
Models
Seven families, those of our quantitative research platform, each with its fact sheet: what it looks at, how it works, what it provides and what it can’t tell.
Complete interpretation
The readings are tested against each other and against the economic context, monetary policy and prices; each weighs by what its model can provide.
View
One stance per asset class, with its reasoning, its scenarios and what would change it, in the month’s reports.
Illustrative example · from readings to a stance
What the models say
- Cycle: slowdown
- Regimes: oil turns to stress
- Volatility: above its average for 15 days
What the context adds
- Crude inventories below their average
Commodities
Higher → Neutral
What would change it: oil returning to calm or inventories recovering.
The models give three readings; interpretation decides what they mean. The slowdown and the stress would point lower, but with low inventories the stress looks like it comes from supply, not demand. So the stance moves down to neutral, not lower, and the report says what would move it.
Illustrations: they show how each model works; they are not market data or Athena’s current view. “Up” is not a price forecast or a recommendation: it is a model’s output. pp: percentage points.
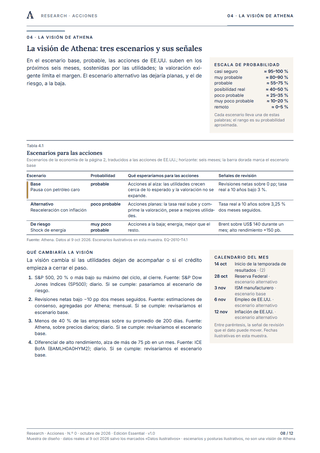
Three scenarios with their signals, not a single bet.
The same three economic scenarios run through the four reports; each report translates them to its asset class.
Sample · No. 0 · common to the four reports
| Scenario | Probability | What happens in the economy | Observable signals |
|---|---|---|---|
| BasePause with expensive oil | likely | Activity grows close to trend and core inflation stays contained; the Federal Reserve pauses after its September hike. | Signals: Three-month core inflation below 3%; Brent below USD 140. |
| AlternativeReacceleration with inflation | unlikely | Employment accelerates and core inflation rises; the Federal Reserve raises its rate again. | Signals: Three-month core inflation above 3.5% in two releases; jobless claims below 200,000. |
| RiskEnergy shock | very unlikely | A new jump in oil slows consumption and makes credit dearer, with higher inflation in the short term. | Signals: Brent above USD 140 for a month. |
Design sample: scenarios and stances are illustrative, not Athena's view.
One report or all four, for those who decide for themselves.
Essential
One report of your choice.
USD 19 a month + VAT
(USD 22.61 in total)
ProRecommended
All four reports and the common page that connects them: the economy, the markets and the reading for each class.
USD 39 a month + VAT
(USD 46.41 in total)
Annual billing: 12 months for the price of 10. One reader per subscription. Online purchase: coming soon; a plan can be chosen today, with a request to be notified.
This material is general and impersonal and does not consider any person's financial situation, objectives or risk profile. It is not investment advice, a recommendation, or an offer or solicitation to buy or sell any security or financial instrument. Views expressed are Athena's as of the date shown and may change without notice. Athena is not registered in Chile's Registry of Financial Service Providers (RPSF) and is not supervised by the CMF. Figures and analysis rely on cited, dated sources; they may contain errors and become outdated. Past performance or scenarios do not guarantee future results. All investing involves risk, including loss of capital. Before deciding, it is advisable to consult a duly authorised adviser.